

This week we are taking a closer look at the Problem Solving and Data Analysis Questions on the redesigned SAT Math section.
What does this question look like?
The redesigned SAT will contain a number of questions that involve charts/graphs and statistical measures. These questions test your ability to summarize and manipulate data. They may ask you to compare averages, interpret a graph, calculate the standard deviation, or find the best fit line in a scatterplot.
Example:
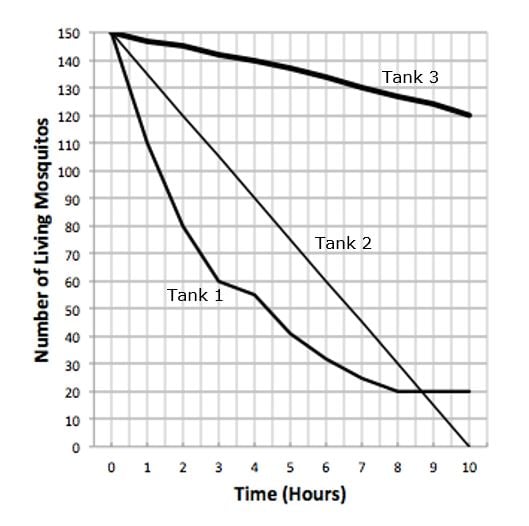
An etymologist is studying the impact of insecticides on mosquitos. She sets up three tanks, each filled with a different insecticide. She then introduces 150 living mosquitos to each of the tanks when t = 0, where t equals the number of hours that have passed since the beginning of the experiment. The tanks are then sealed so that no mosquitos can escape. Every hour she returns to the tank to count the number of mosquitos that have died and the number that remain alive. The data from the etymologist’s experiment are shown for each tank above. Which of the following statements is reflected in the graph above?
A) For the first 2 hours, the number of dead mosquitos is increasing at a faster rate in Tank 1 than in Tank 2.
B) Over the final 2 hours, the number of living mosquitos in Tank 2 stabilizes.
C) At time (t = 0), Tank 2 has no living mosquitos remaining.
D) At time (t = 3), the number of living mosquitos in Tank 3 is approximately 10% of the original number of living mosquitos in the tank.
(Correct answer: A)
How often does this question appear?
Each test will contain 17 Problem Solving and Data Analysis Questions (29% of the total Math score). All of these questions will appear on the Calculator section of the exam.
How does this compare to the current SAT?
The current SAT also tests data analysis, but data analysis will now makes up a larger part of the test. This rise of importance is because the redesigned SAT contains less geometry. Instead, the College Board now thinks data analysis is more important for college and real-life.
There are also new data analysis concepts on the redesigned SAT. These new concepts (standard deviation, exponential growth/decay, etc.) may be harder than the data analysis required on the current SAT.
What does this mean for students?
Slow down. Many students rush through charts and graphs because they look easy. But attention to detail is key when tackling these problems. These questions also tend to have lengthy descriptions to introduce the data. Carefully read all parts of the question to be sure you answer correctly.
You should also review data analysis concepts such as mean, median, mode, and standard deviation before taking the test.
Will this question be on the PSAT?
Yes, and it will make up approximately the same percentage of the test as on the SAT.


